
3 Key Tools in Website Analytics

In the final chapter or part 7 of the complete text-based SEO tutorial, we will take a look at 3 key tools in website analytics and essential data that every website owner should know and use.
| Guide to this fascinating post |
| Google Search Console |
| Google Analytics |
| Analysis tips and best practices |
Website analytics is an important part of search engine optimization. There is a saying that goes, “What gets measured gets better.” This is 100% true in SEO. Using the right tools to track and analyze website performance will help you answer important SEO questions, such as:
- What keywords do you rank for on Google (full information about keywords)
- What is the click-through rate of your pages in search results?
- Which country do your visitors come from?
- Which channels bring you the most traffic?
- How visitors interact with your pages
- What are your most visited pages?
To help you understand the basics, we’ll cover 3 important analytics tools that every website owner should have: Google Search Console, Google Analytics, and Rank Tracking.
Google Search Console (Google Search Console)
Search Console is a free online tool (or suite of tools) by Google that helps webmasters see their site’s performance in Google search and optimize their websites.
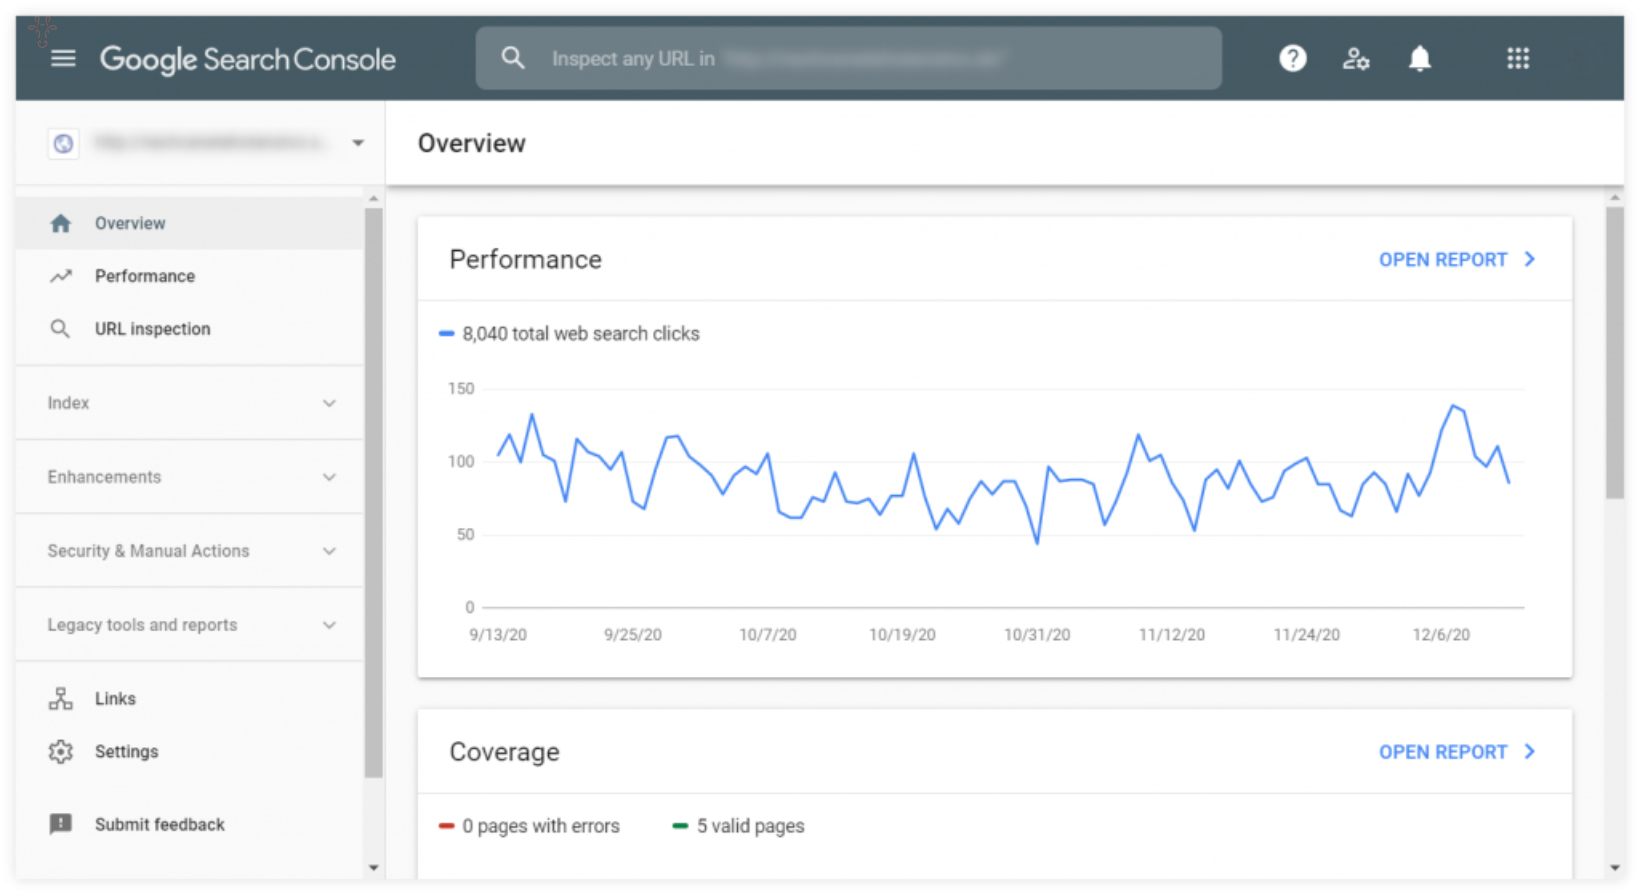
Google Search Console Tools
Google Search Console is an essential tool that is hard to replace. Every website owner should use it.
| Note: To set up Google Search Console, you must first verify website ownership. That’s it! |
Search Console includes several dashboards, from an overview of your website’s performance to reports on important issues you need to address.
- Performance: Gives you insight into how your site is performing in Google search results.
- URL Inspection: Gives you information about Google’s indexed version of each of your pages.
- Coverage: Shows what pages are indexed in Google and reports any indexing issues.
- Sitemap: Allows you to add a new sitemap and view your previous submissions or issues.
- Removals: Acts as a tool to temporarily block any page from search results.
- Improvements: Provides information about your improvements (such as AMP, sitelinks, etc.) and user experience and usability issues.
- Manual Actions: Shows whether you have a manual penalty from Google.
- Security Issues: Reports any security issues detected on your site.
- Links: Provides an overview of your links (both external and internal).
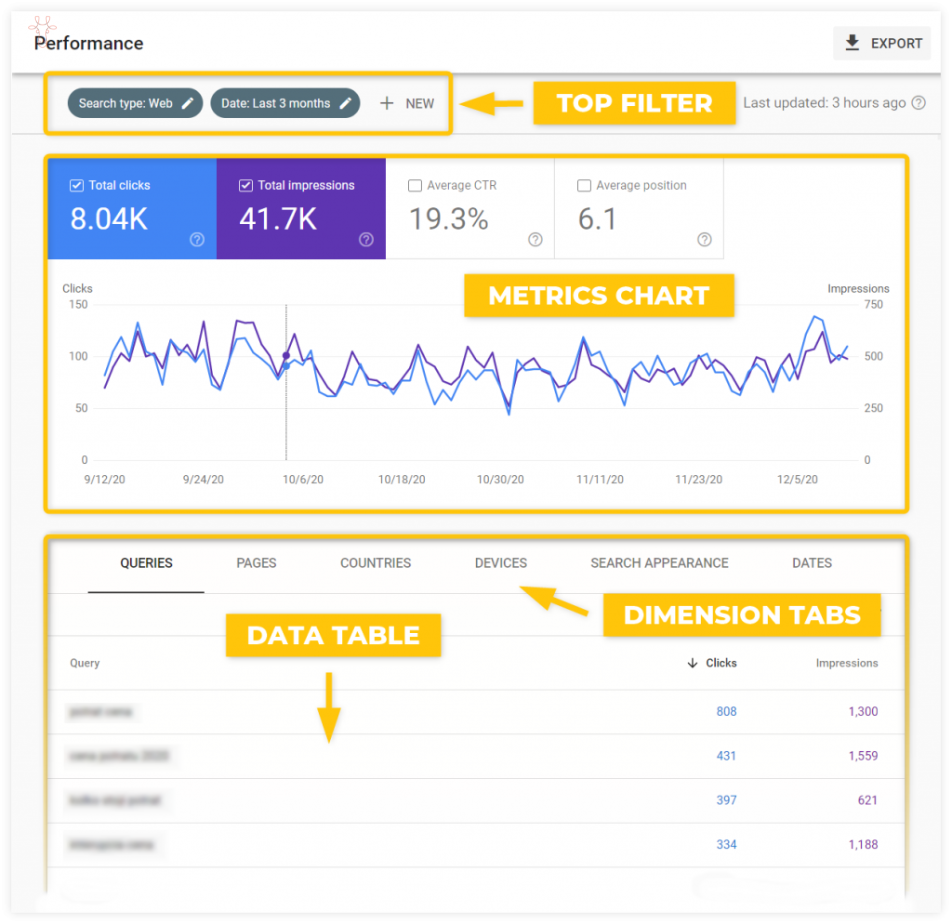
The report you will spend the most time with, and the one we will examine closely in this chapter, is the Performance report.
Performance report
The Performance Report gives you an overview of your site’s performance in Google Search. It includes 3 main areas that you can configure to see the data you need:
- Top filter: Allows you to select search type, date range, and filter dimensions.
- Metric Chart: Shows a chart with 4 main metrics (Clicks, Impressions, Average CTR, and Average Position). You can select any combination of metrics by clicking on them.
- Dimension sheets with data table: Allows you to select a preferred dimension and view the data in a simple table.
How Google Search Console works
In addition to basic (but very useful) data like top queries or top pages, the performance report is a goldmine of various deeper insights into your site’s search performance. Let’s take a look at a few specific use cases:
Fix performance loss
When analyzing any changes in your performance (e.g. a sudden drop in clicks), always try to get to the root of the problem by examining different dimensions to understand exactly what caused the changes. Sometimes overall performance can be dramatically affected by a change in a specific country, a drop in the ranking of a large keyword, or a performance issue on a specific type of device.
| Tip: Create a comparison between the next two time periods (Filter above – Date – Compare) to see the biggest changes compared to the previous time period. |
Find pages that need CTR optimization
Look at top-performing searches that have low click-through rates (whether using the average CTR metric or comparing the number of views and clicks). There’s a good chance you can improve CTR by writing a better title tag and meta description for the page that’s ranking for the query.
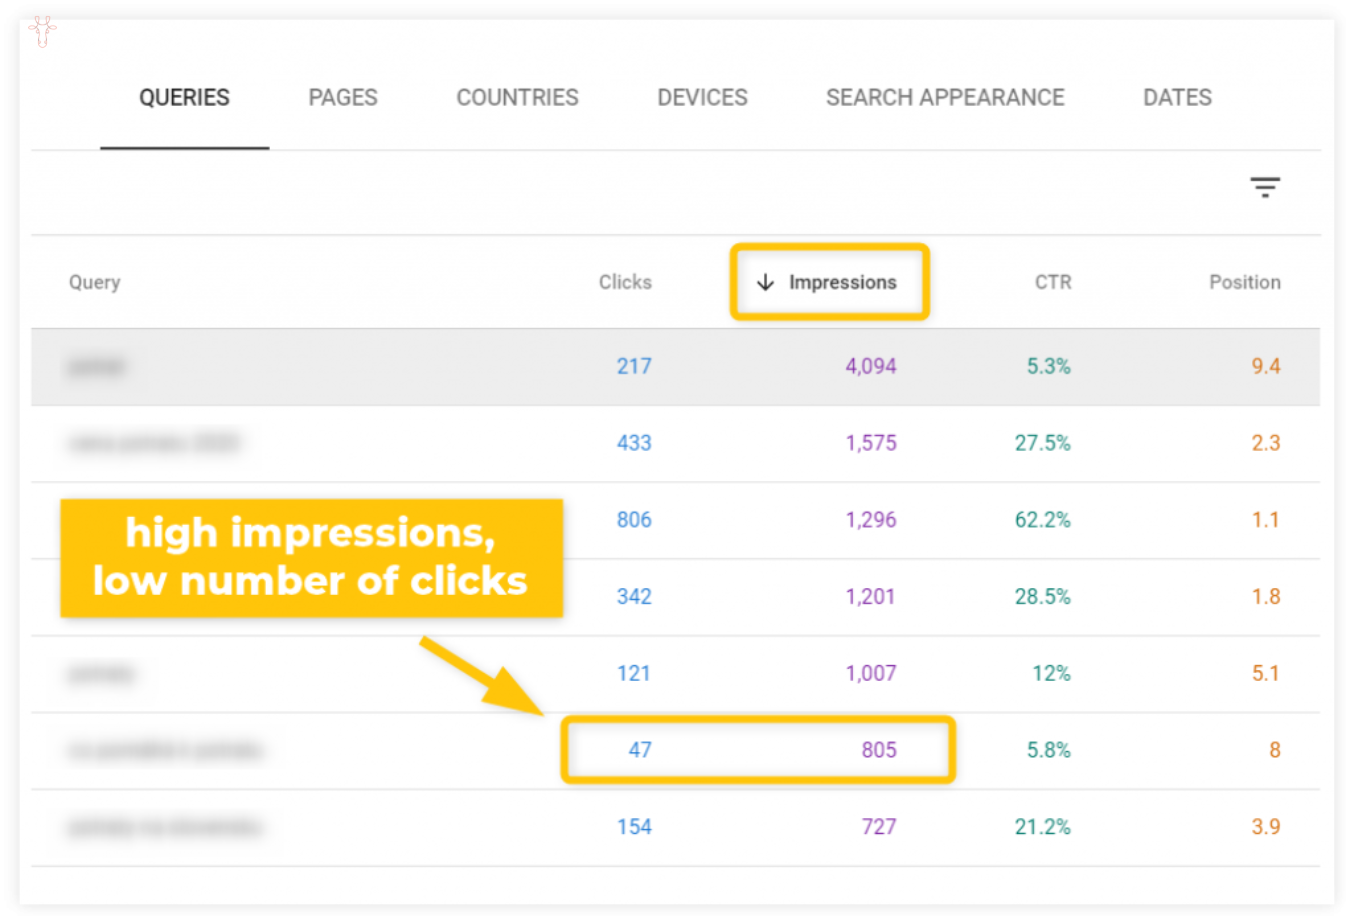
Writing better meta descriptions and title tags to increase click-through rates
Compare your performance on desktop and mobile devices
In the filter above, select the device and instead of the filter, select Compare. You can see a comparison of your performance on desktop and mobile devices and take appropriate steps to further optimize your site.
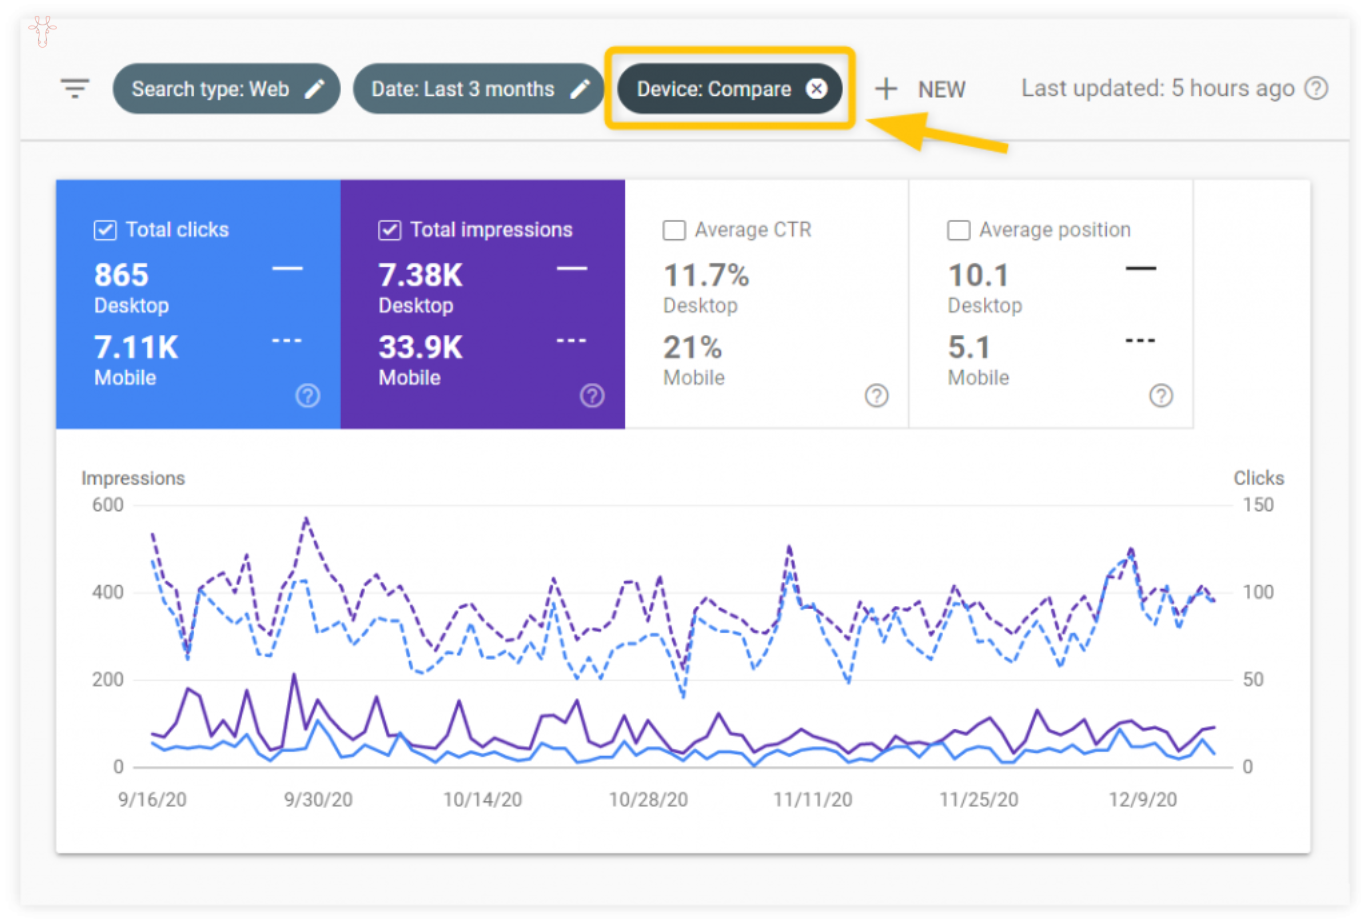
Comparing devices in Google Search Console
Find low-key keywords that you can easily rank for.
In the dimension table, use the filter to only show queries that you rank for in position 20 or lower (which means a keyword that you rank for in SERP 3 or higher). Once you find such a keyword, go to the Pages tab to see the page it ranks for. These are pages that may need some optimization to rank better.
See if you can improve the page that targets the keyword or create new content that focuses on the keyword.
Compare branded and non-branded searches
You can use the filter above to only show queries that include (“queries containing”) your brand name. You’ll see how much of your search traffic comes from branded keywords and how those keywords are performing in Google search.
Google Analytics
Google Analytics is a free website analytics tool that tracks and reports on website traffic and user behavior. It is a powerful tool that provides a huge amount of useful data.The problem is that many beginners feel confused and lost when they open their GA account. It’s quite natural that there are so many reports, so many metrics, so many different charts, and complicated navigation. If we don’t know what they are, we will definitely get confused.
So, how do you learn using Google Analytics? One step at a time.
What kind of data can you find in GA?
Google Analytics is made up of various reports. The home dashboard gives you an overview of key performance metrics. To see more, you can go to detailed reports. Reports are divided into 5 main categories based on the type of data they provide. You can find them in the menu on the left.
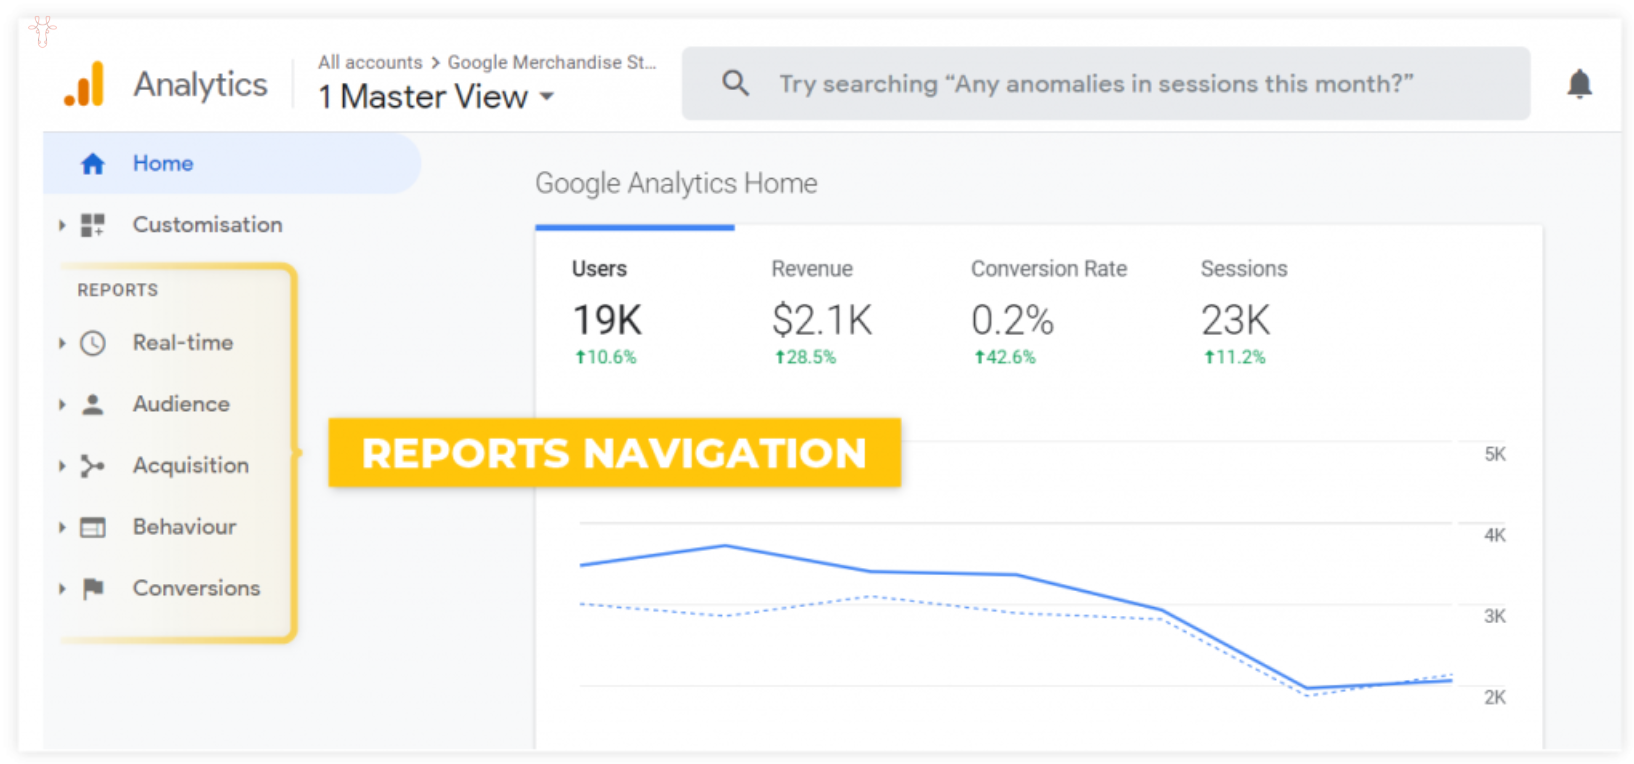
Reports in Google Analytics
- Real-time: User activity as it happens in real time
- Audience: Everything you need to know about your visitors (demographics, interests, technology used, etc.)
- Acquisition: Where your traffic is coming from (traffic channels, top referral pages, etc.)
- Behavior: What visitors do on your website (what pages they visit and how they interact with them)
- Conversions: Details on how your visitors converted (based on your goals; e.g. purchase, subscription, affiliate link click, etc.)
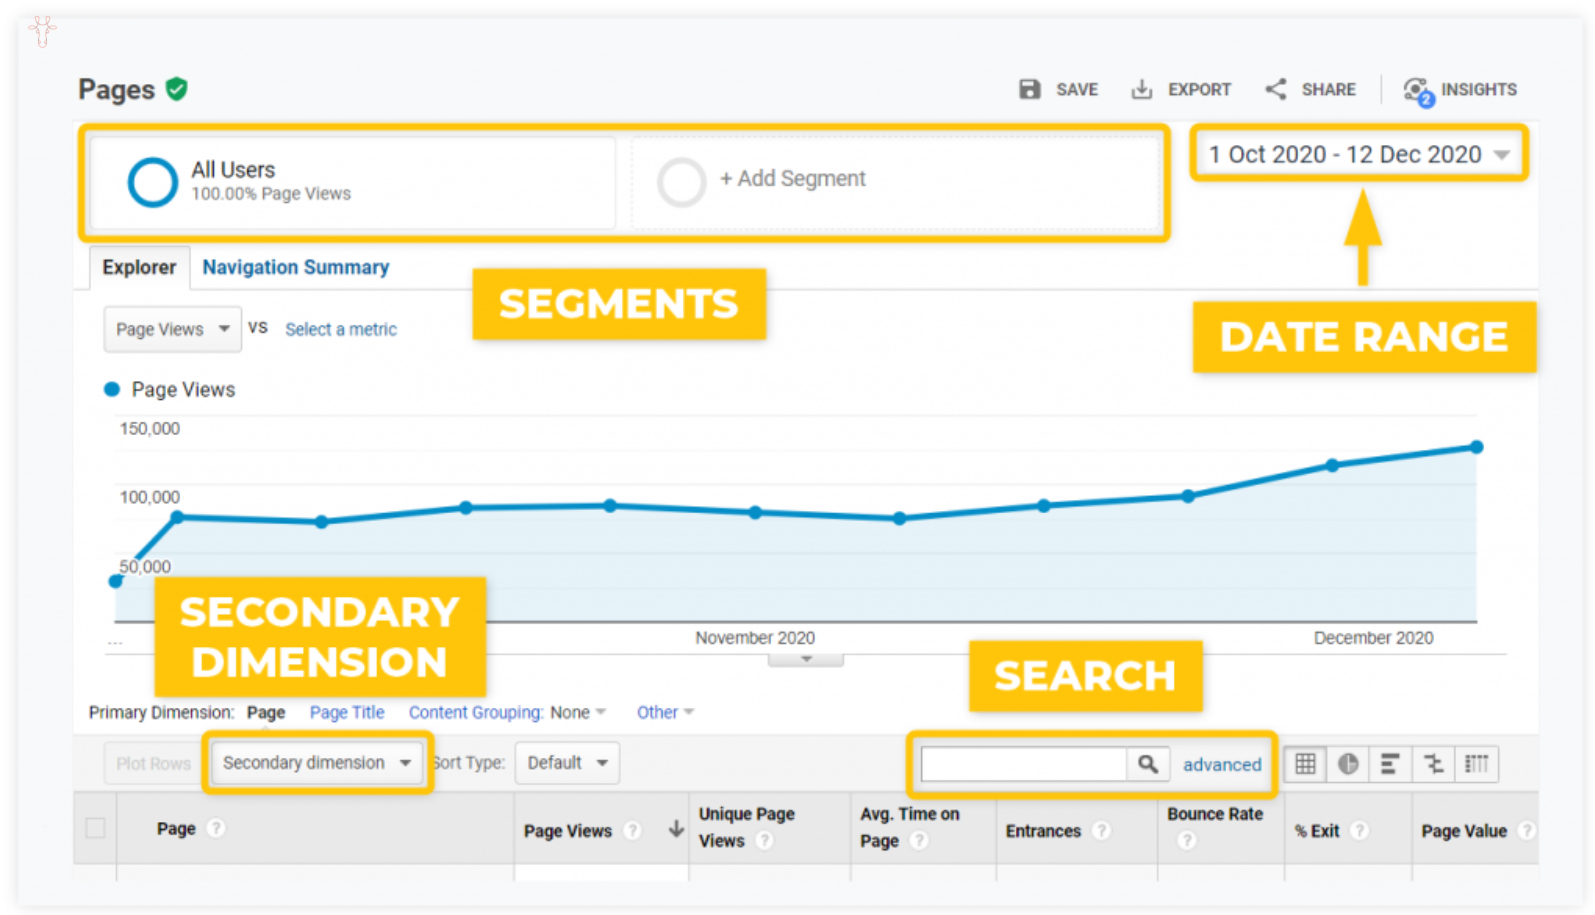
Data segmentation
Within each report, you can further segment the data to see detailed results based on your specific needs. Segmentation and filtering are crucial in selecting the right data for your analysis.
Data segmentation in Google Analytics
time range
Choosing the right time frame is the first thing you should do when working with any analytics tool. You can find the date range selector at the top right of any report. This allows you to view data across different time frames or compare two time periods.
Sections
A Segment is any subset of data in Google Analytics. You can choose one of the default segments (such as Organic Traffic, Mobile Traffic) or create and save a new one to speed up your workflow. For example: You can create a specific segment that only shows your organic blog traffic so you can analyze the organic reach of your articles separately from other pages.
Here is what the settings look like:
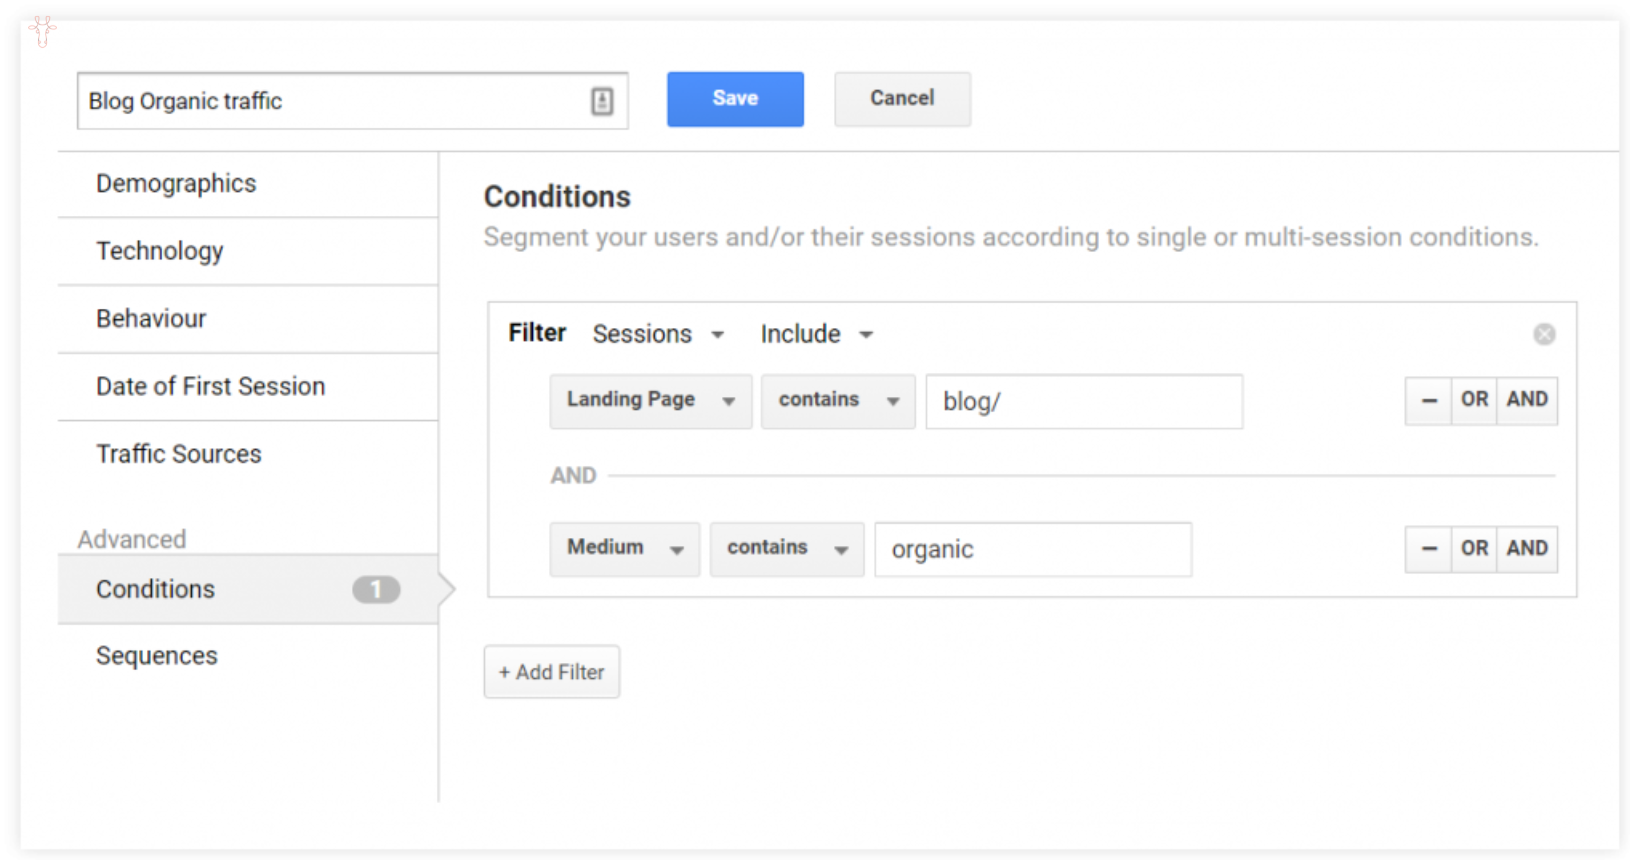
Segment settings in Google Analytics
Secondary dimension
A secondary dimension is an additional dimension that you can add to the primary dimension of a given report. For example: In an All Pages report that shows the top pages, you can add a secondary dimension of User Type to see the ratio of new visitors versus returning visitors for each page.
to search
There is a simple search option at the top of each data table to narrow down the results.
The most useful reports
We’d need a separate definitive guide to describe all the features and data reports that Google Analytics offers. But the truth is, the vast majority of novice users will do just fine by sticking with a few basic reports. Here are the most useful ones:
1. See the most visited pages on your website
Behavior, site content, all pages
The All Pages report is the most basic report and one of the main reasons to use Google Analytics is to see how much traffic your pages are getting. This is useful for determining what people are interested in when they visit your website and deciding which pages need improvement.
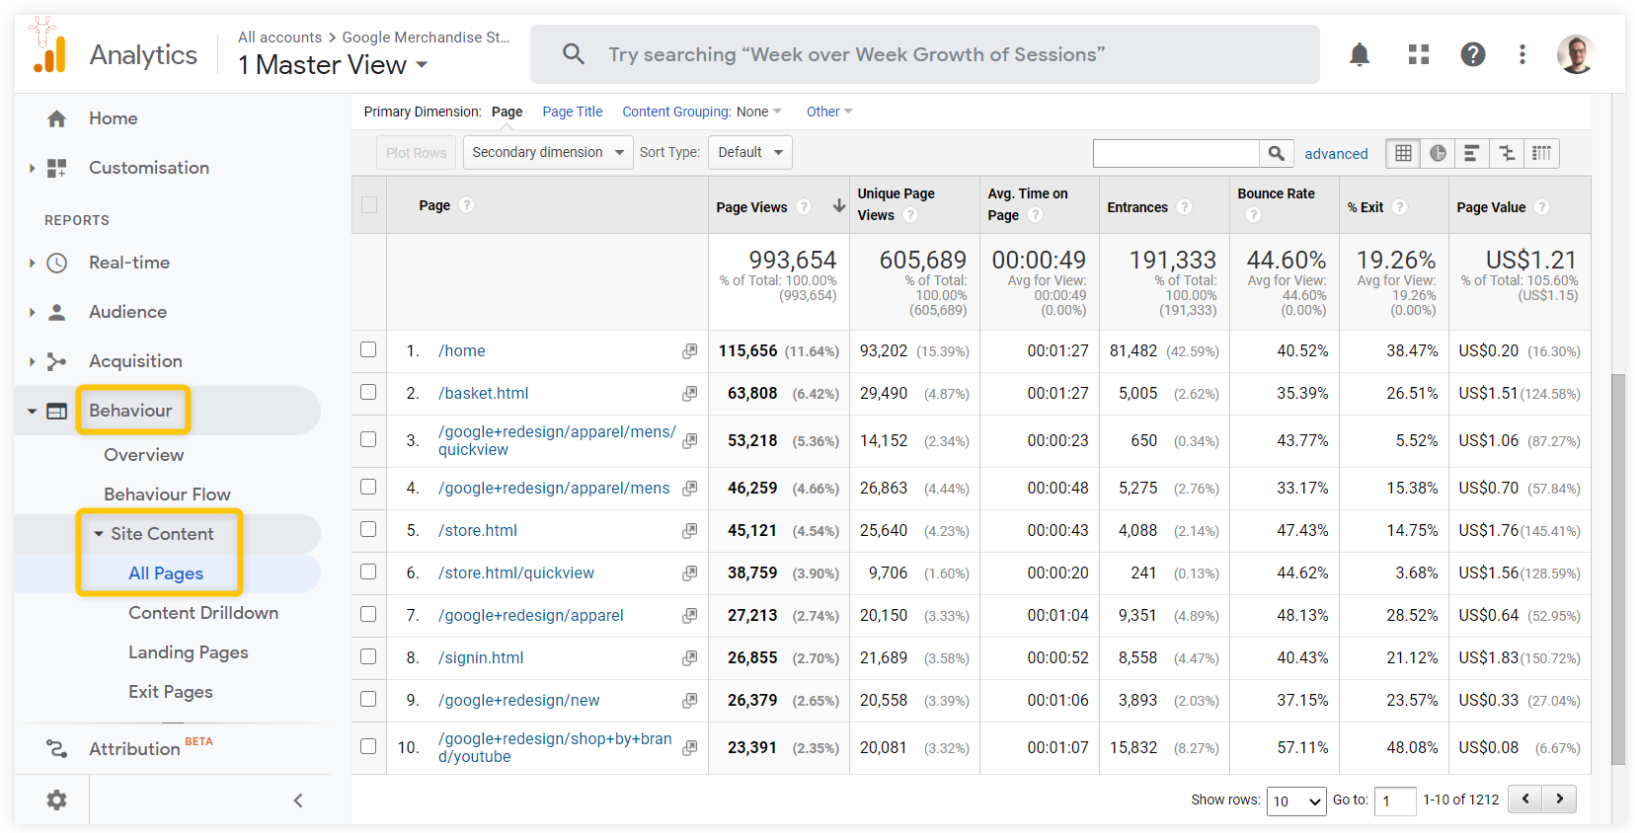
Check important pages on your website with Google Analytics
2. See the first pages people visit on your site
Behavior, site content, landing pages
The Landing Pages report is very similar to the All Pages report, but it only shows the top pages that people used to get to your website. It’s also a great report to use when analyzing organic traffic from Google (pages that people visit from search are always landing pages).
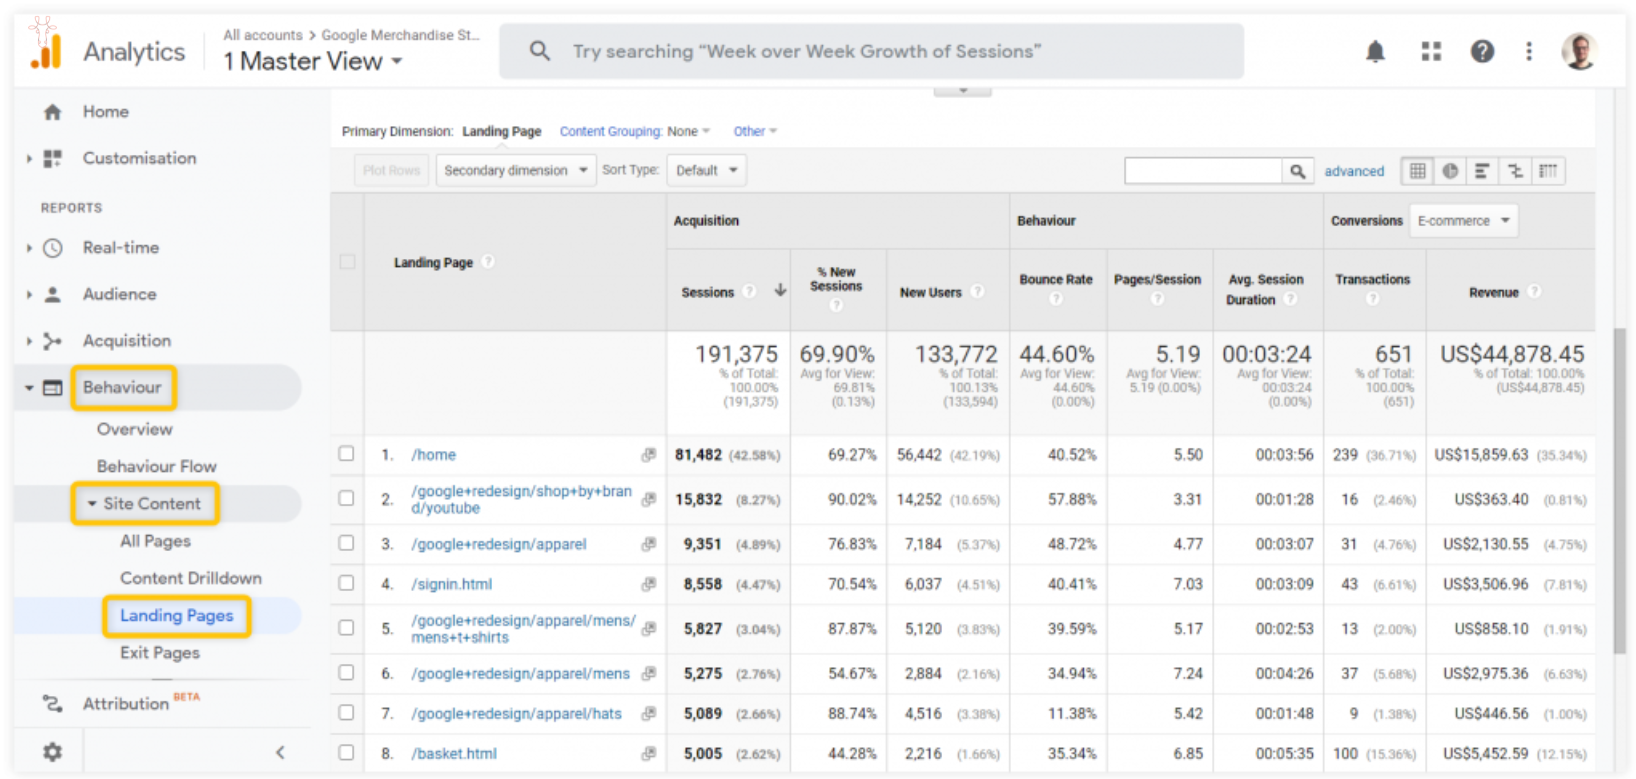
Check the pages people see for the first time with Google Analytics
3. Find your best traffic sources
Acquisition, all traffic
In addition to seeing how your pages are performing, it’s also important to know where your traffic is coming from. The Total Traffic report includes several sections:
- Channels: See the percentage of your traffic based on the most common traffic channels (organic, referral, direct, social, etc.).
- Source/Medium: See your traffic origin and source category (e.g. google/organic, bing/organic)
- Referrals: See the top pages that refer traffic to your site
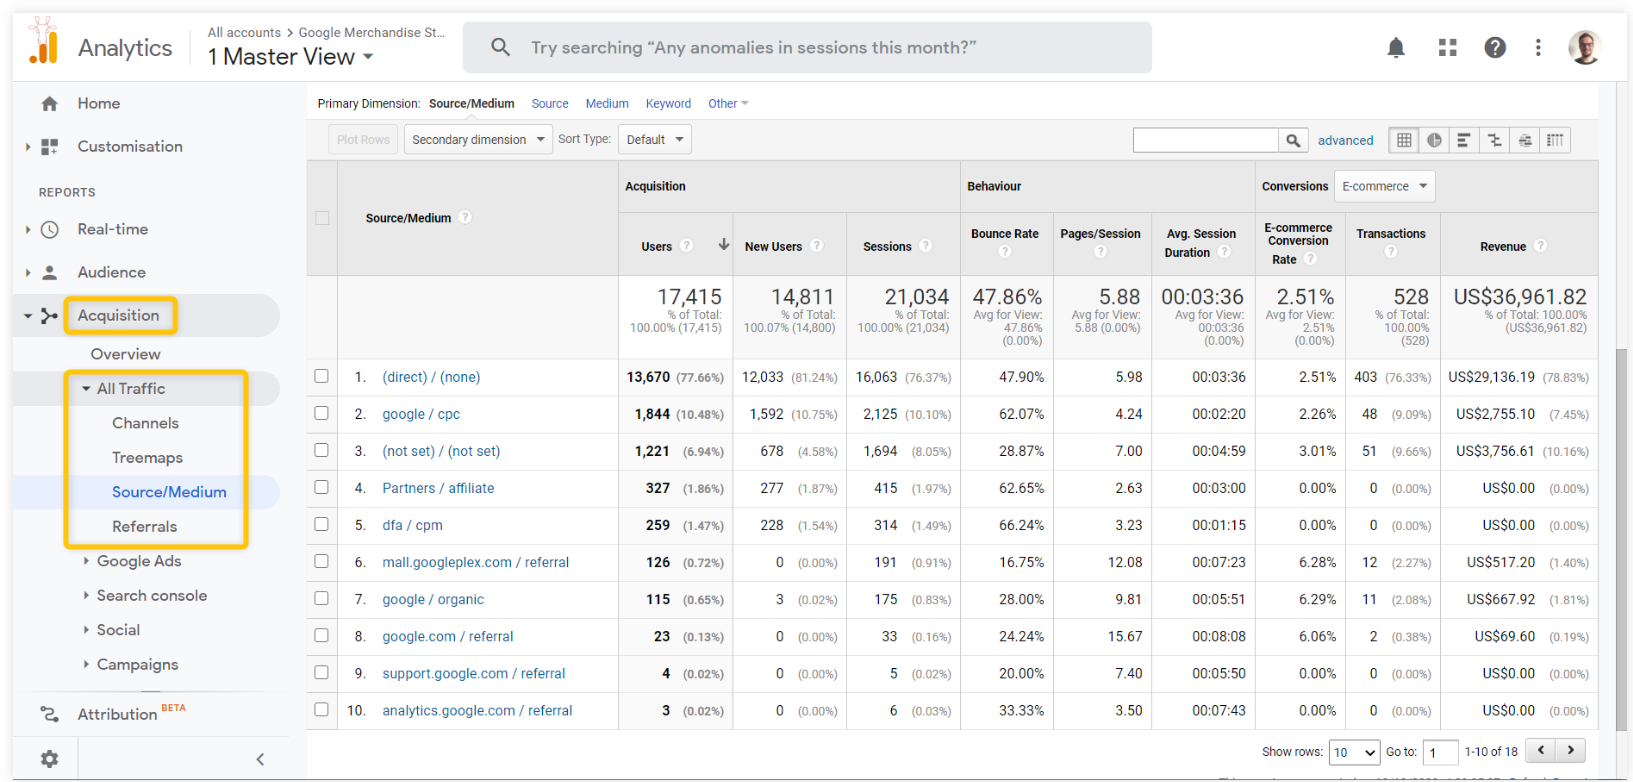
Find your traffic sources with Google Analytics
For example, let’s say you notice an increase in your traffic. You can go to the Source/Media report, compare two time periods to see which source/media combination has the biggest increase in users compared to the previous time period.
Once you find it, you can add different secondary dimensions to find out more information (for example, a landing page secondary dimension to see the pages from which users entered your website, or a country/city secondary dimension depending on your target market).
4. Know your visitors
Audience, demographics; audience, geography, location
Last but not least, Google Analytics can give you insights about your audience. The most useful ones are demographics (age, gender) and location (countries). Here’s what the Audience Gender Demographics report looks like:
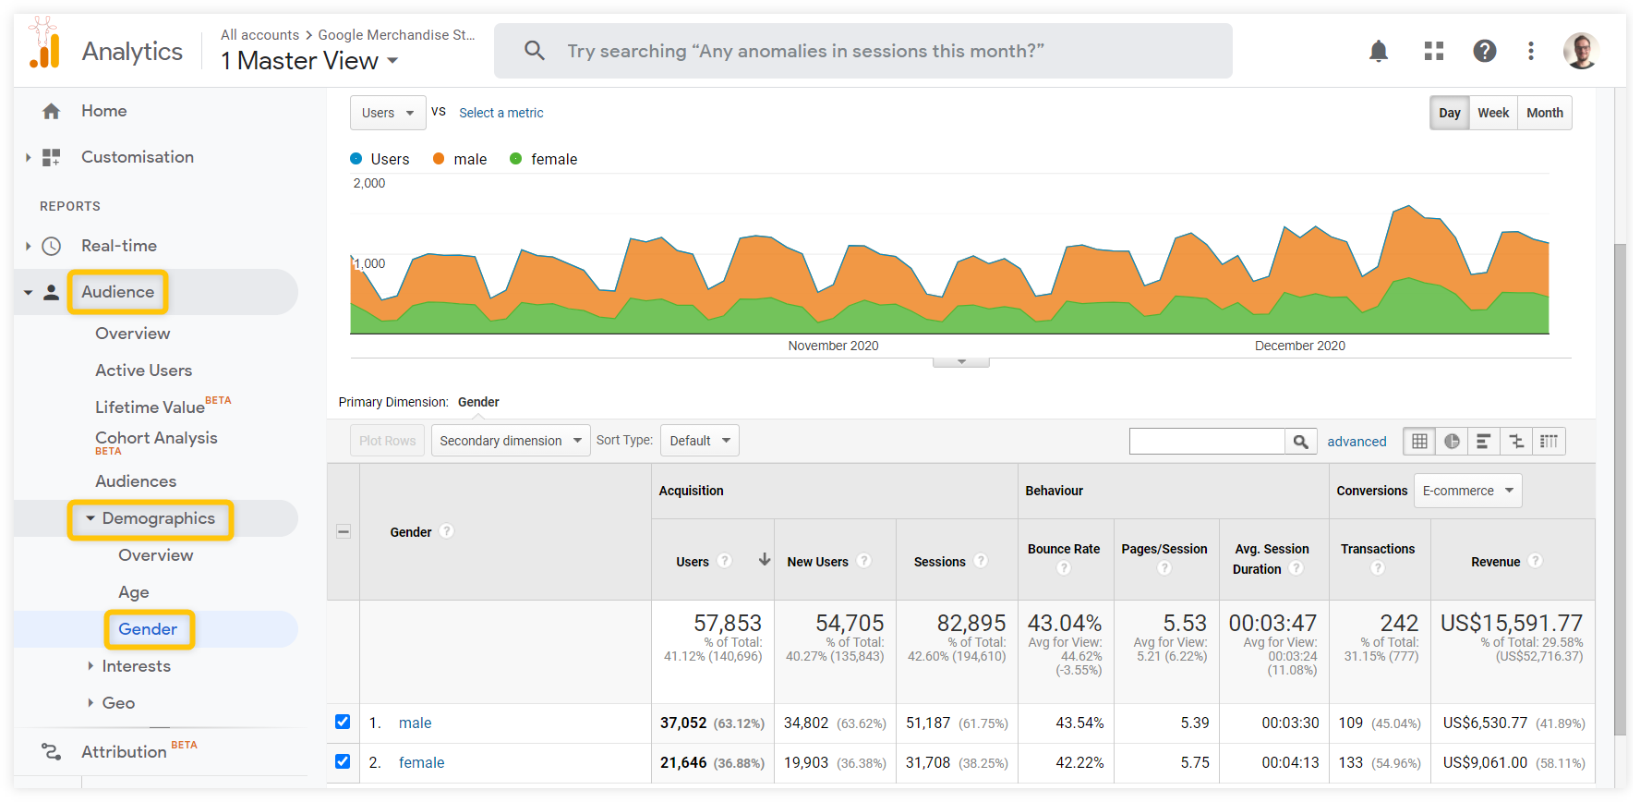
Know your audience information with Google Analytics
مفیدترین معیارها
Google Analytics comes with various metrics that measure three things:
- How much traffic do you get (acquisition metrics)
- How people engage with your site (behavior metrics)
- Achieving your goals (conversion metrics)
Traffic attraction criteria
The most common traffic acquisition metrics are often confused, so here’s a quick explanation of the differences between them:
- Users: A user is a unique visitor to your website, more visits by the same user do not increase the number of users.
- Sessions: The period of time a user actively browses your website (up to 30 minutes of inactivity). Typically, a user visits multiple pages in a session.
- Page Views: A page view is counted each time a visitor visits a page. If the page is visited repeatedly by a user, the number of page views is counted (so the number of page views is always greater than the number of sessions).
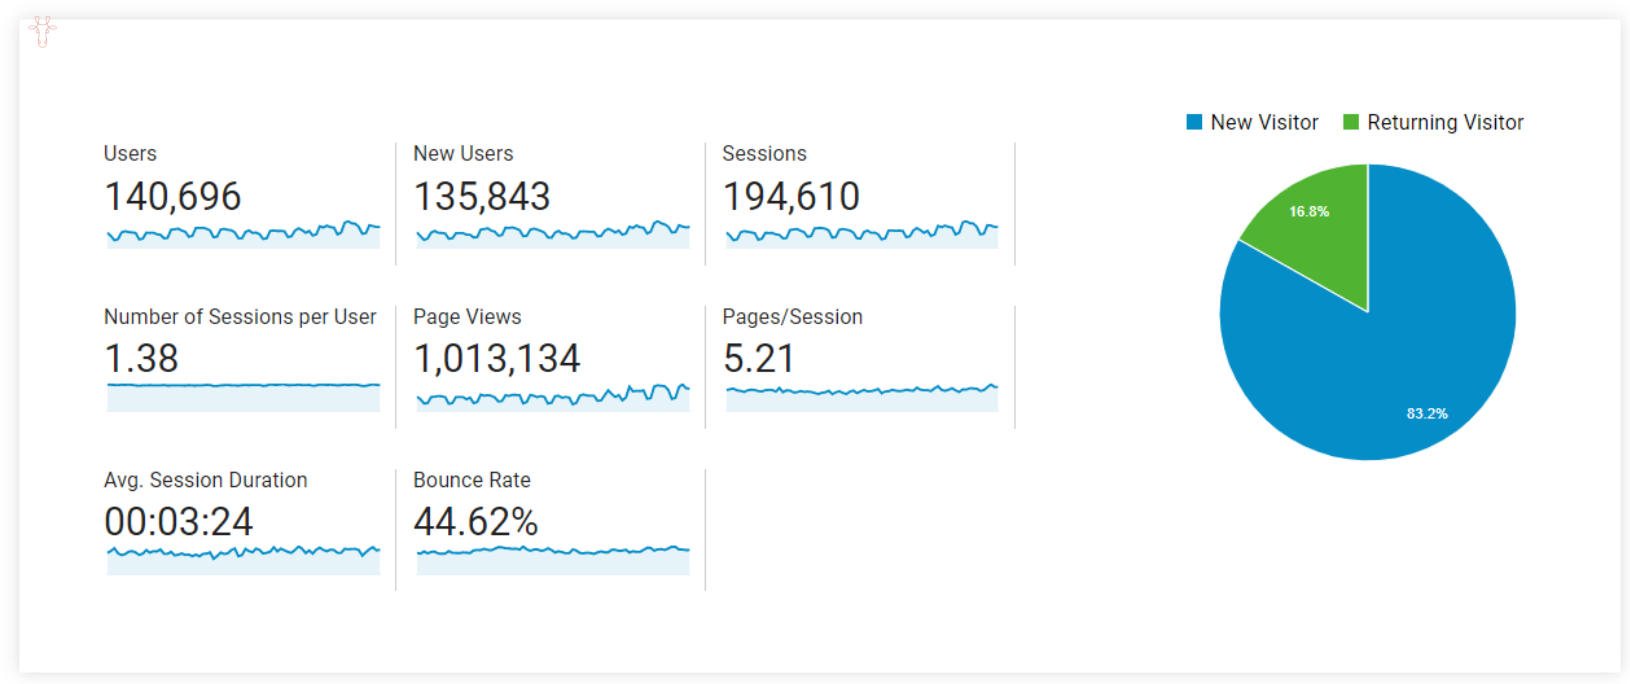
Website traffic metrics in Google Analytics
bounce rate
The bounce rate metric shows the percentage of visitors who left a website without taking any action. A high bounce rate isn’t always a bad thing, but in general, a low bounce rate is almost always better.
Pageview rate per session
This metric tells you how many pages a user visits on average in a session. The Pages Per Session metric can be a good indicator of overall engagement. To improve this ratio, think about ways to get your visitors to click through to other pages:
- Add related products/posts
- Enter the “Read More” boxes
- Links to related pages in the text
Average time on page / session duration
Both time-based metrics in Google Analytics have their own issues with accuracy, so we don’t recommend jumping to conclusions based on either metric. If you’re going to choose one, average time on page is a better indicator of how long people spend on your page.
Analysis tips and best practices
We will end this chapter with some useful tips on how to effectively measure your performance.
Watch the overall progress, check the details
Your performance will likely fluctuate from day to day. That’s why it’s always a good idea to look at the bigger picture rather than obsessing over every little change on a daily basis. On the other hand, if a change is not anticipated, you can almost never draw conclusions from default reports. The first rule of analysis is to always dig as far as possible to find the root cause.
Understand the criteria
Remember that you don’t need to analyze all metrics all the time, but it’s good to have an overview of what they mean to avoid misinterpreting the data.
Always try to understand the context.
Don’t take the data for granted, but look for reasons why something happened. For example, when it comes to troubleshooting a ranking drop, there could be a variety of reasons, both internal and external:
- Recent changes to the website
- Google Algorithm Update
- Technical problems or website outages
- Google manual action
- Error in rank tracking tool
A thorough review of your Google Search Console, Google Analytics, and Rank Tracker should give you a better understanding of the problem, meaning you can make an informed decision about your next steps.
Use annotations to add context
Google Analytics and most rank trackers allow you to create annotations to add context to your analytics dashboards. You can annotate specific actions or events to see if they had an impact on your website performance. For example:
- Google Algorithm Update
- Any major changes to your website
- Article update
- Start a marketing campaign
- Website problems and outages
- Seasonal events (like Black Friday)
Set alerts to be notified of any significant changes.
Most analytics tools allow you to set up email alerts that notify you when certain conditions are met. This is a great way to stay informed of any significant changes without spending all your time glued to a screen with data tables.